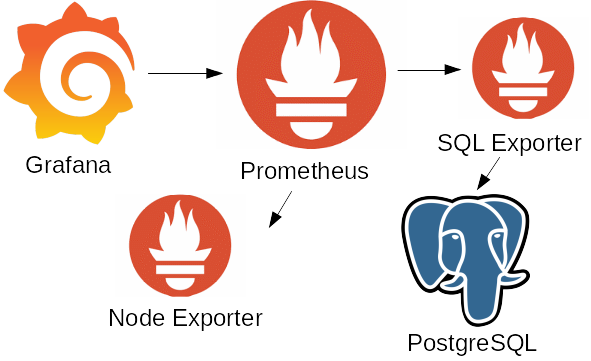
Sometimes we are all in need of doing some quick and basic setup to monitor our key services. In these cases, this super simple cheatsheet comes into play.

This exact guideline is meant to be used for several node Elasticsearch clusters but can also be used to monitor almost everything – just replace ES exporter with anything that suits your own taste and set up a nice informative dashboard.
Setting up Node Exporters
Node exporters are the very core of prometheus metric sources since they provide things of fundamental importance such as CPU load, disk io stats, and other hardware parameters, which are often being the cornerstone of an occurred problem.
Add a user for running exporter
sudo useradd node_exporter -s /sbin/nologinCheck the latest release on github page (https://github.com/prometheus/node_exporter/releases), grab it, untar it, copy the exporter itself. 0.17 is the latest so far.
wget https://github.com/prometheus/node_exporter/releases/download/v0.17.0/node_exporter-0.17.0.linux-amd64.tar.gz
tar xvfz node_exporter-0.17.0.linux-amd64.tar.gz
sudo cp node_exporter-0.17.0.linux-amd64/node_exporter /usr/sbin/
Create systemd service for the exporter
vi (or nano :)) /etc/systemd/system/node_exporter.servicePaste the simple config into it
[Unit]
Description=Node Exporter

[Service]
User=node_exporter
ExecStart=/usr/sbin/node_exporter

[Install]
WantedBy=multi-user.target
Do some final preparations and check if all is ok
sudo systemctl daemon-reload
sudo systemctl enable node_exporter
sudo systemctl start node_exporter
sudo systemctl status node_exporter
curl http://localhost:9100/metrics
Perform these steps for every node in the ES cluster.
Elasticsearch exporter
First check the compatibility matrix for ES version here: https://github.com/vvanholl/elasticsearch-prometheus-exporter Then do just this (as root ofc):
cd /usr/share/elasticsearch/
./bin/elasticsearch-plugin install -b https://distfiles.compuscene.net/elasticsearch/elasticsearch-prometheus-exporter-X.X.X.X.zip (put you plugin version here)
systemctl restart elasticsearch-elk
systemctl status elasticsearch-elk
If service is up and running – then nothing bad happened. ES might be screaming (YELLOW or RED state if you have restarted all the nodes), but within 5-10 minutes it will return to GREEN. I was wondering if this is a graceful way to perform plugin installation – so far it seems that yes, it is.
Check if metrics have been exposed:
http://<node_ip>:9200/_prometheus/metricsPerform this on every node, one-by-one.
Prometheus setup and Grafana dashboard
Tell prometheus from where it should get metrics
vi /etc/prometheus/prometheus.ymlAdd this to the end of the file: For ES metrics
- job_name: "es_metrics" (just an example - put something informative here according to your needs)
  scrape_interval: "15s"
  metrics_path: "/_prometheus/metrics"
  static_configs:
  - targets: ['<node1_ip>:9200','<node2_ip>:9200','<node3_ip>:9200']
For node metrics
- job_name: "es_node"
  metrics_path: "/metrics"
  scrape_interval: "15s"
  static_configs:
  - targets: ['<node1_ip>:9100,'<ip2>:9100', //and so on for all the nodes you have - you get the point//]
Close config and restart prometheus
systemctl restart prometheus
systemctl status prometheus
It can take some time before metrics appear – up to 5 mins or so. As for grafana dashboard – you can use whatever you like, but for this particular example let’s take this one, it’s quite informative and precise – https://grafana.com/dashboards/266 If all goes well, after a few minutes you can see some nice graphs.
The original autor: Nikolaj, DevOps Engineer, cloudinfrastack

