
Prometheus is an open-source system monitoring and alerting toolkit originally built at SoundCloud. Since its release in 2012, many companies and organizations have adopted Prometheus, and the project has a very active community. It is developed as an open project, independent of any company or organization.
It is based on metrics and is designed to measure and visualise the overall health and performance of services, it is similar to tools like Graphana/Graphite, but offering a more robust and comprehensive feature set, including:
- PromQL, a query language to sort and manipulate data.
- Data model with labels to identify metrics and key/value pairs that work very well with PromQL.
- Time series collection is pull-based and happens over HTTP.
- Targets do not have to be manually set, the discovery service takes care of that instead. Static configuration is still possible.
- Graphing and dashboard are modular and can be superseded by alternatives like Grafana if one desires so.
Data Collection
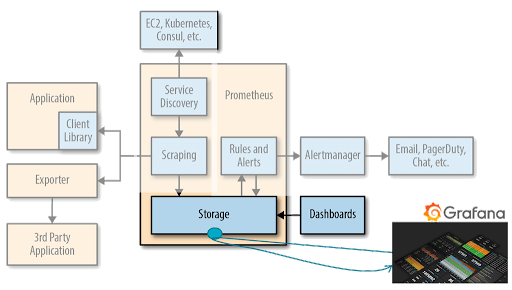
Let’s start with the most important feature of any monitoring tool, which is its data collection framework. There are two ways of collecting data in Prometheus, which one you use depends on your particular needs and access to application’s source code.
- Client library: You have access to application’s source code. This is the ideal situation because it allows you to monitor any part of your service without the need to rely on any external API. You merely import the Prometheus client library into your codebase and by writing not more than a handful of lines of code, you are able to leverage the power of the entire Prometheus framework.
- Exporter: This is useful in cases where it is not feasible to instrument a given system with Prometheus metrics directly (for example, HAProxy or Linux system stats). A demo of a minimal exporter written in Python can be found here. A good list of usable exporters may be found here.
Service Discovery
Prometheus is a pull-based system, therefore it requires some sort of service discovery to work in the first place. Which one you use will depend on your infrastructure needs and approach to automation. For example, assuming you already use Hashicorp’s Consul for configuration management and service discovery, you will want to use that. And Prometheus has it. And it works out of the box.
It can be configured by defining access parameters for our Consul agent and a list of Consul services for which we want to query targets. Prometheus then discovers given services from the local Consul agent. For more information, I recommend this blog post.
Next
Next time, we will be looking into how Prometheus stores its data and the ways in which we use this data to monitor our critical infrastructure.
The original autor: Michal H., Junior DevOps Engineer, cloudinfrastack