
ELK Stack is a tool for centralized logs from your infrastructure at one spot, optimized for fast search. In this post I will tell you about the basics of ELK stack.
For each technology we are going to discuss its basic features and functions, examples, and we will be connecting its features together. All examples will be done on Ubuntu server 18.04 LTS with ELK 7.x for.
There is also a hidden B in the ELK acronym, which stands for Beat 🙂
Filebeat
Filebeat is a lightweight shipper for logs.
Basic info
Filebeat is a logging agent written in Go. It is designed to use low memory, process large bulks of data, and support encryption. It also uses backpressure-sensitive protocol – it can slow down when Logstash or Elastic is overloaded. Filebeat remembers the location of last sent data and is capable of reconnecting in case of e.g network issues, without losing any data.
Filebeat is also capable of parsing logs and splitting them into different fields, but we will leave parsing to Logstash.
Install using Apt
All commands are run with “sudo”:
- add Elastic’s signing key
wget -qO - https://artifacts.elastic.co/GPG-KEY-elasticsearch | apt-key add -- add the repository to system
echo “deb https://artifacts.elastic.co/packages/7.x/apt stable main” >> /etc/apt/sources.list.d/beats.list- update repositories and install
apt-get update && apt-get install filebeatConfiguration
Config file is located at /etc/filebeat/filebeat.yml, reference config file can be found at /etc/filebeat/filebeat.reference.yml.
root@lbthumbs1.cloudinfrastack.com /etc/filebeat/cdo # cat filebeat.yml
---
shutdown_timeout: 0
name: lbthumbs1.cloudinfrastack.com
tags: []
fields:
  log_type: lbthumbs-haproxy
fields_under_root: false
filebeat:
  registry:
  path: "/var/lib/filebeat/registry"
config.inputs:
  enabled: 'true'
  path: "/etc/filebeat/inputs.d/*.yml"
shutdown_timeout: 0

output:
  logstash:
     hosts:
     - [“<LOGSTASH_IP1>:5044”, “<LOGSTASH_IP2>:5044”]
     loadbalance: true
Output can also be Redis, Kafka, or even directly Elastic. We personally use Logstash as the next destination. You can use only one host as output, so there is no need for loadbalance attribute.
You have to tell Filebeat which logs should be collected and sent to the next processing unit. This can be done using inputs. Inputs are located in /etc/filebeat/inputs. This folder could contain multiple input definitions, we don’t need that in this example but it’s always good to know your options :).
In this case, we want to collect HAProxy access log – /var/log/haproxy/access.log.
root@lbthumbs1.cloudinfrastack.com /etc/filebeat/inputs.d # cat lbthumbs1.yml
---
- type: log
paths:
  - /var/log/haproxy/access.log
encoding: plain
document_type: lbthumbs-haproxy
Logstash
Logstash is a tool to collect, process, and forward events / log messages.
Basic info
Logstash is written in Java + Ruby. It dynamically ingests, transforms, and ships data.
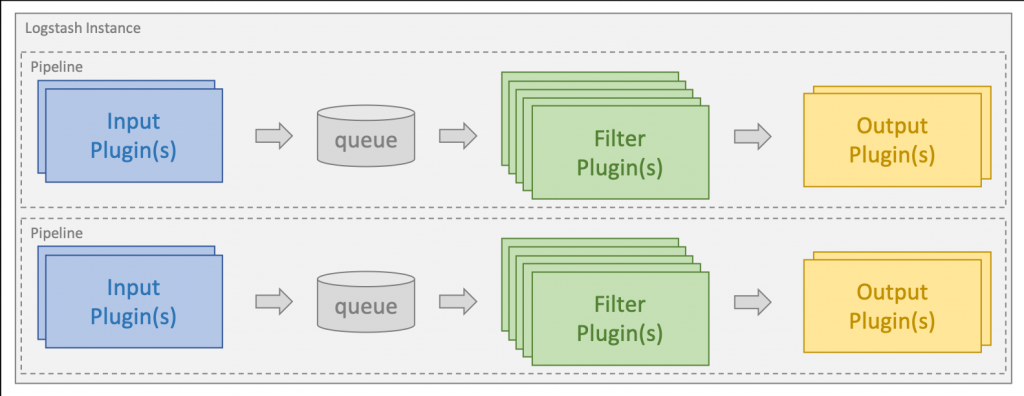
When input plugin collects data, it can be processed by multiple filters, which modify and annotate the data. Then Logstash transports data to output plugins, which can forward them to various external programs, for example Elasticsearch. Basic outline of ELK
Install using Apt
Installation steps are pretty much the same as for Filebeat. The only difference is the package itself and dependency:
apt update && apt install default-jre apt-transport-https logstashConfiguration
Config files are located at /etc/logstash/conf.d.
root@logstash1.cloudinfrastack.com/etc/logstash/conf.d# ls
filter_lbhaproxy input_beats output_elasticsearch
We will start from the bottom, which means input plugin. It’s very simple:
input {
  beats {
     port => "5044"
    }
      }
This config tells Logstash that input comes from beat, and to listen on port 5044.
Output config is also pretty simple:
output {
   if [fields][log_type] == "lbthumbs-haproxy" {
       elasticsearch {
       hosts => ["10.10.10.193"]
       index => "lbthumbs-haproxy-%{+YYYY.MM.dd}"
      }
    }
   else {
      elasticsearch {
      hosts => ["10.10.10.193"]
        }
   }
}
This configures output as Elasticsearch, which has 1 node described in the hosts parameter.
Logstash will send all logs with log_type “lb-haproxy” into index _lbhaproxy, a new index is created every day. Anything else is sent to the default Elastic index, usually named logstash-%{+YYYY.MM.dd} in our case.
The most difficult part is the filter config. Each line in our access.log looks something like this:
2020-12-04T22:20:04.565779+01:00 200,"GET https://thumbs.cloudinfrastack.com/Y/E/h/xYEhCw23.640x360.0.jpg?vt=1607209199&sg=hJXg68Iv5ucz5zoNpA0kfg&bl= HTTP/2.0","86.49.244.157","10.13.14.240","80","thumbs_cache_backend.cis1","cis1-thumbs2","thumbs_cache_frontend.cis1",3468,4,0,0,0,0,30396,--We have to understand what each part of the string means to write the filter and to convert it to the proper data type. Filter plugin in this case is dissect. Simple split operator.
filter {
   if [fields][log_type] == "lbthumbs-haproxy" {
    dissect {
    mapping => {"message" => '%{date} %{status},"%{request}","%{remote_addr}","%{server_addr}","%{port}","%{backend_name}","%{backend_server}","%{frontend}",%{duration},%{backend_response_time},%{backend_connection_time},%{time_in_queue},%{client_request_time},%{data_transmission_time},%{bytes_sent},%{disconnection_state}'
}
convert_datatype => {
    "data_transmission_time" => "float"
    "duration" => "float"
    "backend_response_time" => "float"
    "backend_connection_time" => "float"
    "time_in_queue" => "float"
    "client_request_time" => "float"
    "bytes_sent" => "float"
   }
  }
 }
}
More info about writing custom filters can be found here.
Elasticsearch
Now to the most important part of ELK stack – Elasticsearch.
Basic info
Elasticsearch is a distributed, scalable, and highly available search and analytics engine, built on top of Apache Lucene, and exceling at full-text search in near-real time (meaning document is indexed and searchable within seconds). It is developed in Java.
Elastic is considered a NoSQL database. It doesn’t require you to specify the database structure in advance, but it’s created based on embedded data. “Throw a JSON-document at it, and it will do some educated guessing to infer its type.” Elasticsearch itself calls this approach “schema flexible”. Elasticsearch stores complex data structures that have been serialized as JSON documents.
Almost every action can be performed over its RESTful API.
Logical Concepts
Document
Document is the basic unit of information that can be indexed in Elasticsearch. It’s expressed as JSON.
Index
Index is a collection of documents. It is the highest-level entity you can query against. All documents in the index should be logically related. In our environment we divide indices logically based on location and type of service. For example, every OpenStack cluster has its own index.
Shard
Index can be subdivided into multiple pieces called shards. Each shard works independently on other shards. Basically, every shard is a fully functional subpart of the index. Shards can be distributed across multiple nodes, which ensures redundancy and increases query capacity.
Replica
Each document belongs into some shard, called primary shard. This shard can be duplicated to create a replica shard. This ensures another level of redundancy.
Inverted index
Elasticsearch is using an inverted index, which supports fast full-text search. Inverted index lists all unique words/numbers that appear in documents and identifies all the documents which contain a given word. It is a hashmap-like data structure, which directs a word to a document.
Install using APT
Once again, installation is very similar to the previous cases, just change the package name:
apt update && apt install default-jre apt-transport-https logstashConfiguration
Elasticsearch is installed with pretty good default values and can be operated out of the box.
Main config file is located at /etc/elasticsearch/elasticsearch.yml. However, most config changes can be done through API.
You can verify that your Elasticsearch instance is running properly by running:
root@elk1.cloudinfrastack.lan /etc/elasticsearch # curl -X GET "localhost:9200/"
{
  "name" : "elk1",
  "cluster_name" : "elasticsearch",
  "cluster_uuid" : "Yx8CMn8VQJOaubk3irtEyQ",
  "version" : {
    "number" : "7.10.0",
    "build_flavor" : "default",
    "build_type" : "deb",
  "build_hash" : "51e9d6f22758d0374a0f3f5c6e8f3a7997850f96",
  "build_date" : "2020-11-09T21:30:33.964949Z",
  "build_snapshot" : false,
  "lucene_version" : "8.7.0",
  "minimum_wire_compatibility_version" : "6.8.0",
  "minimum_index_compatibility_version" : "6.0.0-beta1"
  },
  "tagline" : "You Know, for Search"
}
Currently Elasticsearch is listening on port 9200 (REST), but only on localhost.
root@differenthost1.cloudinfrastack.lan /home/antonin.dvorak # curl -X GET "10.10.10.193:9200/cluster/settings?pretty" curl: (7) Failed to connect to 10.10.10.193 port 9200: Connection refused Edit the config file /etc/elasticsearch/elasticsearch.yml_:
network.host: 0.0.0.0
http.port: 9200
discovery.type: single-node
Now port 9200 can be accessed from the outside. But keep in mind this could also be a security issue.
Port 9300 is used for internal node communication.
So now we have a simple one node Elasticsearch instance. More info about configuring clusters can be found here.
Kibana
Fine, we’ve got the data in Elastic, but there is no simple way for viewing or visualizing it, and that’s exactly what Kibana is for.
Basic info
Kibana is a browser-based data visualization dashboard for Elasticsearch.
It is used for searching, viewing, and visualizing data from Elasticsearch and analysing the data using bar charts, pie charts, tables, histograms, and maps. Those elements can be combined into one Kibana dashboard to display multiple points of view.
I won’t get into the details on how to create these elements, you can view pre-prepared demos.
Install using Apt
For the last time, I promise, the installation is done in the same way like the previous services.
sudo apt-get update && sudo apt-get apt-transport-https install kibanaConfiguration
First configuration is very simple:
root@kibana1.cloudinfrastack.lan /etc/kibana # cat kibana.yml

elasticsearch.url: http://10.10.10.193:9200
Now you can view Kibana in your web browser, default login is simple – admin/admin.
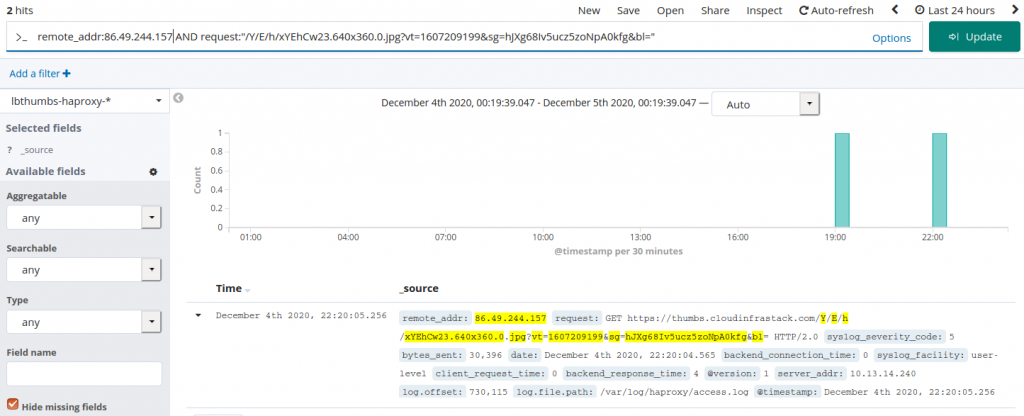
To view your data, you have to create index pattern first. This can be done through:
Management -> Index Patterns -> Create Index Pattern.
Finally, there is our data:
Elastalert
Elastalert is an alerting tool for Elasticsearch.
Basic info
Elastalert is a very useful tool for alerting on anomalies, spikes, or other patterns of interest from data in Elasticsearch.
As far as I know, ELK offers the alerting feature in Enterprise version, but not entirely fully in the free version (this might not be entirely true).
Elastalert rules are configured through YAML rules, which can alert when:
- X events in Y time (frequency type)
- Rate of events increases/decreases (spike)
- Less than X events in Y time (flatline)
And many others.. It supports multiple alert types:
- Jira
- Slack
- etc.
In our case we integrated alerts using webhooks in the chat platform Mattermost.
Grafana integration
Already using visualization platforms in your infrastructure or searching for a new one? Good.
Basic info
Grafana is a powerful tool for visualization. It supports multiple data sources, for example:
- Graphite
- Prometheus
- Elasticsearch
- MySQL
- And many others
If Grafana is already used in your infrastructure, the next logical step is to extend your dashboards by data obtained from Elasticsearch.
Again, I won’t get into the details of how to configure the whole Grafana instance. This part of this article is more of “nice to know” information when dealing with Elasticsearch visualizations.
But if you are interested in how to install and configure your Grafana, I will provide useful links for you.
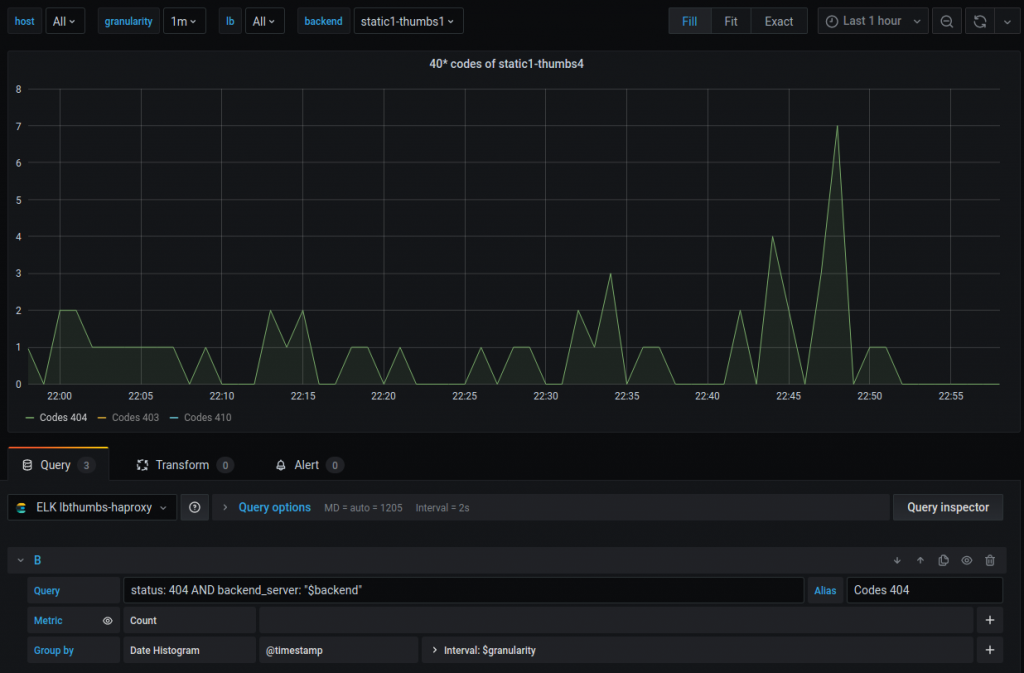
Example
After adding Elasticsearch datasource, here is an example of our visualization of 404 status codes for requests on loadbalancer HAProxy:
The original autor: Antonin, Team Lead for part-time/DevOps Delivery Manager, cloudinfrastack