
In previous blog posts, my colleagues have introduced Prometheus and explained in detail how it works. For those who did not read those posts; Prometheus is basically pull-style monitoring. You have a service which sends requests for metrics and target nodes respond with them via http/s protocols.
When using Prometheus, you get to a point when you wonder if there is a way to have redundant metric collecting. Since there is a thing called Federation you might think that this is the redundancy that you want. But then you read the documentation of Federating Prometheus nodes and you close the tab while feeling disappointed and having more questions than answers. Federation works on the ability to query metrics of another Prometheus instance. This sounds a little redundancy-like, but there is a big NO. Prometheus has no way of deduplicating metrics, meaning that the values collected will be colliding.
There are many approaches to this issue, either you have a proxy-like program, where you have two independent instances of Prometheus, and a load balancing programs in front of it like Promxy. Okay, now we are close to redundant metrics, but let’s say what if the amount of ingested metrics is so large that every time you query a metric you have to wait ages for them to load, or more importantly, what if one or both nodes die? You lose your values metrics. Why? Because they are all stored on a drive that Prometheus uses. Of course, you can outsmart this by saving the metrics to some sort of network drive, but the performance will suffer greatly. That is why Thanos exists, to solve the problems that could be huge obstacles in production environments.
What even is Thanos? And how does it work? Thanos is a bundle of programs that can be used to create Highly Available metric system with unlimited scalability. It works by aggregating TSDB blocks from Prometheus on an object storage of your choice (S3, Google cloud storage, Swift, …). Thanos is divided into four components: Sidecar, Store, Compactor and Query. All of these components communicate via a gRPC protocol and are able to detect when a new one is added (Via a service discovery)
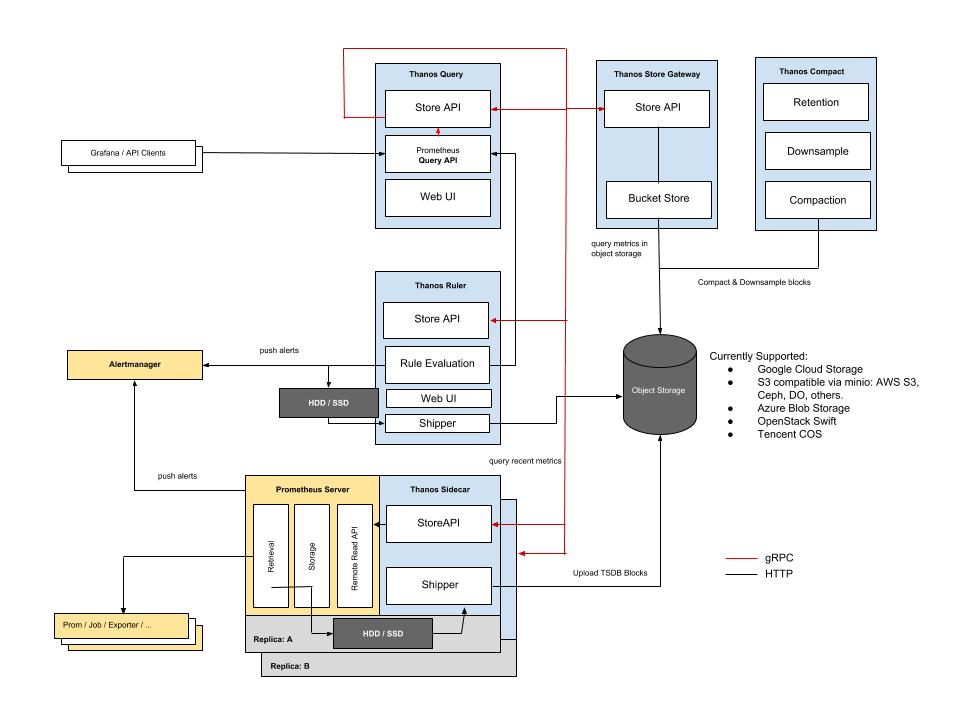
Sidecar processes have to be deployed beside a Prometheus on one instance. The purpose of that is sending freshly created TSDB blocks to the object storage and also to receive a promQL requests from the Query process.
Query process takes care of sending promQL queries to Sidecars and Store while returning them to whatever uses it as a data source, since it acts like a normal Prometheus instance on the outside. It also takes care of deduplicating metrics, from various Prometheus instances, so the values won’t collide with each other.
Store process is the middleman between Query and object storage. It handles listing metrics from the storage and makes them available for the rest of the cluster.
Last process on our list is Compactor, which takes care of compacting/down sampling TSDB blocks in our object storage. But instead of decreasing the size it can actually increase up to three times. The thing it that the goal of down sampling is not saving disk space. The goal is to get faster query for range queries of big intervals like a month or a year.
In the beginning we had a single Prometheus node, but the host count grew bigger, and the required retention got longer also, so we had to find a solution for this problem. Increasing disk space and resource usage is not an option, since it would be resource inefficient.
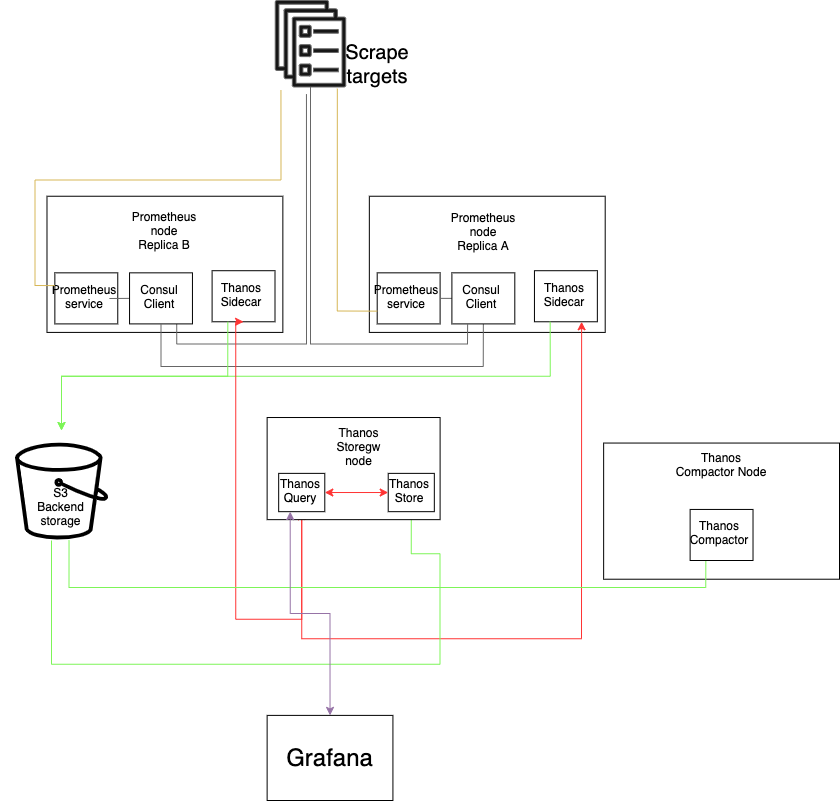
Our monitoring cluster is composed by two Prometheus instances with Consul for service discovery, Thanos Storegw for accessing the metrics, and object storage (In this case we have a temporary Minio single node with Raid 5, soon we will switch those metrics to Ceph) and a Thanos Compactor.
The decision to have Query and Store components together was made because there is no real reason to have instance for each one. Both are not that resource hungry and there is no benefit of them apart.
This is all nice but since it should be High availability why do we have two unpaired instances?
Well because in our situation right now, it is not required to have a paired Storegw node. If one Prometheus drops, we have the second one. If both die and get corrupted, only 1h of metrics will be lost, because the rest is stored in an object storage. As for the Compactor, there is a limit of one node per bucket.
The original autor: David, Junior DevOps Engineer, cloudinfrastack