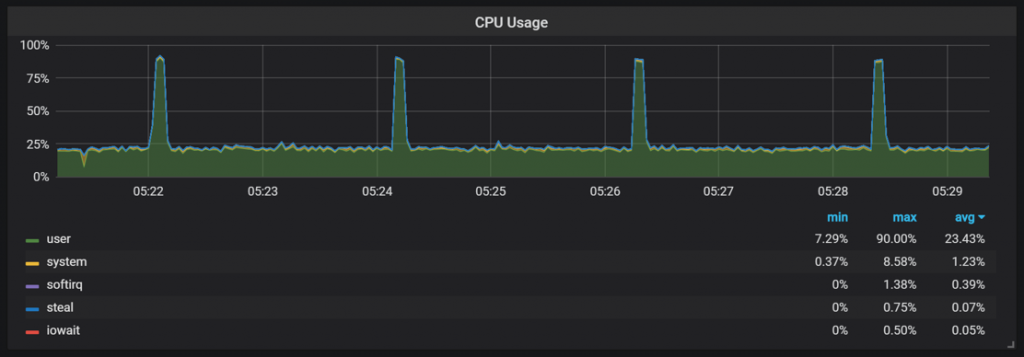
If we are working with monitoring systems, we usually want to know if we have some unusual behavior in our graphs, for example if disk I/O graph is briefly increased. This behavior is called spikes. But how can we catch the spikes correctly if we use Prometheus in our infrastructure?
Prometheus is a TSDB (time series database), it can export data to monitoring systems such as Grafana. Prometheus has 4 types of metrics:
- Gauge
- Counters
- Histogram
- Summary
Gauge is a metric that represents a single numerical value. If we want to monitor the spikes of a particular gauge metric, it can be captured pretty easily: we just need to use a max_over_time function.
max_over_time(node_load[interval])But if talking about monitoring http_request_total, for example, we can’t use a stand-alone max_over_time function. Metrics like http_request_total are counters. A counter is a cumulative metric that represents a single monotonically increasing counter with value which can only increase or be reset to zero on restart. Previously if we wanted to combine over_time functions (avg,max,min) and some rate functions, we needed to compose a range of vectors, but since Prometheus 2.7.0 we are able to use a subquery for these purposes.
Basic sample of subquery looks like this (according to prometheus documentation)
<instant_query> '[' <range> ':' [ <resolution> ] ']' [ offset <duration> ]

<instant_query> is equivalent to query field in /query_range API.
<range> and offset <duration> is similar to a range selector.
<resolution> is optional, which is equivalent to step in /query_range API.
In practice it may look like this:
max_over_time( rate(http_requests_total{status="500"}[1m]) [5m:1m] )Subquery shows us a maximum rate of 500 error codes from the last 5 minutes with 1 minute step and per-second rate of HTTP requests as measured over the last 1 minute.
If we combine it with comparison operators, we can create a query which can be used as a basis for the reporting rule of the monitoring system.
max_over_time((rate(nginx_http_requests_total{status="500"}[1m]) > bool 0.6)[5m:1m])This query will give us only 2 values: 1 and 0. 1 for a critical rate of errors and 0 for non-critical.
Of course, for different types of metrics we need to use a different time range and a different value of comparison, but since we have a built-in subquery in prometheus, it’s much easier to monitor certain metrics(such as errors in http_requests_total).

The original autor: Mikhail, DevOps Engineer, cloudinfrastack

